Research

My postdoctoral research focused on interfacial fluid flows at small scales (bubbles, droplets, jets, and thin films) and their connection to larger questions in industry and the environment. I used a mix of experiments (high-speed imaging) and numerical simulations (using the open-source solvers Gerris and Basilisk), rationalizing observations with theoretical analysis. Some of the primary projects I worked on are listed below.
I've uploaded notes on using Linux and various software tools/packages (command-line tools, Python, and Basilisk simulations) to a wiki that can be accessed at github.com/cfbrasz/cfbrasz.github.io/wiki.

Bursting bubbles and sea spray aerosol

When wind speeds over the ocean are large enough, waves break into foamy whitecaps, entraining bubbles under water. They then rise back to the surface, and between 1018 and 1020 bubbles pop at the surface of the oceans every second, ejecting droplets that can carry sea salts and organic species into the atmosphere. These sea spray aerosol (SSA) particles affect climate, both directly by scattering radiation and indirectly by acting as cloud condensation nuclei, and are parameterized in climate models empirically as a function of wind speed. However, uncertainties are large, and the extent to which these fluxes depend on other variables like sea surface temperature remains unclear.
Bursting bubbles eject droplets via two mechanisms: (i) the bubble cap film itself fragments into film drops (top video), and (ii) the bubble cavity inverts into a jet that breaks up into jet drops (second and third videos).
For jet drops from the smallest bubbles, we can reduce the problem to a single dimensionless parameter, the Laplace number, which is the bubble radius nondimensionalized by a viscous-capillary length scale. Through high-speed imaging experiments and numerical simulations, we mapped out the radius of the top jet drop as a function of this dimensionless bubble radius, exploring how a non-monotonic relationship (of jet drop size to Laplace number - see videos below) arises from separate viscous effects before and after bubble collapse (Brasz et al., 2018). This relationship allows us to incorporate the effects of temperature and predict a significantly smaller minimum jet drop size than previously assumed.
Film drops

Jet drops

High-speed jet drop experiments from bubbles of radius 200 μm in glycerol-water solutions of varying concentrations
Simulations of jet drop formation with Gerris

Nozzle setup on test panel and biofouling growth after 5 weeks of bubbling Adapted from Menesses et al. 2017, Biofouling

Front viewSide view

Preventing biofouling with bubbles

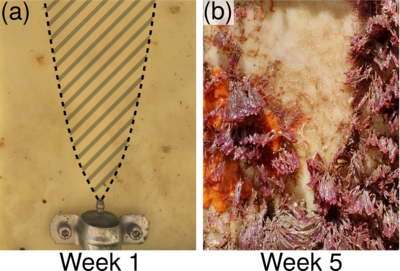
Biofouling, or the accumulation of marine life on submerged surfaces, is a significant problem for the navy and shipping industries, increasing drag and fuel expenditure. One environmentally friendly method proposed for preventing biofouling is the continuous injection of a curtain of bubbles along the bottom of the ship, allowing buoyancy to push bubbles up the surface.

Our team has tested the efficacy of bubbling on preventing biofouling on panels submerged underwater, resulting in V-shaped clean patterns above the nozzle (top images). To learn what sets the shape of this V region, we examined the dependence of bubble trajectories (top videos) on nozzle size, flow rate, and angle in laboratory experiments. I created a video on this work for the Gallery of Fluid Motion at APS DFD that can be viewed here: https://www.youtube.com/watch?v=wouuIjoPvv0. This knowledge could inform future designs of bubble rigs, suggesting optimal spacings and required flow rates.

Computationally, I performed simulations of individual bubbles rising against an inclined wall (bottom videos) to learn how the shear stress on the wall depends on the bubble size, wall angle, and frequency of release. The shear stress can be compared to critical stresses required to remove various types of biofouling.

Simulation (using Basilisk) of a 3 mm-diameter bubble rising in water beneath a wall at an angle of 22.5° from the vertical. Videos are rotated so wall appears vertical. Left movie shows vorticity in the plane z=0, right movie shows the shear stress at the wall in a logarithmic scale between 10-4 Pa (blue) and 1 Pa (red). The threshold of 0.01 Pa suggested by Menesses et al. 2017 is halfway between these bounds, where the color is gray.

Comparison of simulation and experiment at the same conditions, except experiments have a continuous stream of bubbles (flow rate 10 mL/min)